The Arctic Landscape Explorer (Alex) – An Arctic Passion Permafrost Service
by Tillmann Lübker | Published: 01-Feb-24 | Last updated: 01-Feb-24 | Tags : Arctic Landscape Explorer Landscape Change Pan-Arctic permafrost Remote Sensing Story Maps | category: PRESS RELEASE
Near the Native Village of Point
Lay (Iñupiaq: Kali) on Alaska’s Chukchi coast, a lake drained into the nearby Kokolik
River in August 2016. Not an uncommon occurrence, as dozens of lakes in Alaska
have disappeared in recent years. However, the lake was used as a freshwater
source for the village, forcing the community to find an alternative supply (see
this news article). This individual example shows us how communities
living on frozen ground are directly affected by rapid changes in their lands.
And lake drainage is just one
example of how permafrost degradation is changing the Arctic landscape. Others
include coastal and river erosion, thaw slumping, and other thermokarst
processes. Forest and tundra fires can also have profound impacts on the underlying
permafrost. But
where are these changes occurring and how do we know about them? While they
often go unnoticed and undocumented in areas away from human settlements, many
communities have first-hand knowledge of local problems with erosion and thaw
subsidence. In other places, such as remote campsites, mines, along coastlines
or roads, such changes are sometimes less noticed. Remote sensing analysis can reliably
detect and quantitatively assess these key permafrost region disturbances,
helping to make the dynamics of permafrost landscapes visible to everyone.
To make these often complex and
large remotely sensed change data widely accessible and easily explorable, we
have developed the Arctic
Landscape EXplorer, or ALEX in short. The online tool features an
easy-to-use map interface and seamlessly integrated story maps. This
interactive approach combines map content with multimedia elements and
narrative storytelling, encouraging users to engage more deeply with the map
content. Users are guided step-by-step to read and explore the map to gain a
better understanding of the spatially explicit data - and see for themselves
where the permafrost landscape is changing or rather stable.
The change data visualizes disturbance
trends associated with abrupt permafrost degradation during a 20-year period.
Based on 30 m resolution multispectral Landsat-5 TM, Landsat-7 ETM+, and
Landsat-8 OLI imagery (with cloud-cover less than 80%, in the months of July and August), the Tasseled
Cap multi-spectral index was calculated to translate the spectral reflectance
signal to the information of Brightness, Greenness, and Wetness.
Coastal erosion (a change trend where
a land surface transitions to a water surface) is depicted in dark blue colors,
while coastal accretion (a change where a water surface transitions to a land
surface) is depicted in bright orange colors. Drained lakes appear in bright
yellow or orange colors, depending on the soil conditions and vegetation
regrowth. Fire scars can appear in different colors, depending on how long ago
the fire occurred and how much vegetation has grown back since.
In the ALEX tool, you can view
trends for changes in Brightness, Greenness, and Wetness individually, select
different background layers, including a high-resolution satellite basemap, switch
to full-screen mode, locate yourself, measure distances, and learn more about
the data sources used. But try it out yourself: https://alex.awi.de
As we plan to add more features and
more story maps, we would appreciate your feedback. Let us know what you are
missing or how the free service could be improved - or let us know what changes
you have explored and which surprising discoveries you made with the help of
ALEX.
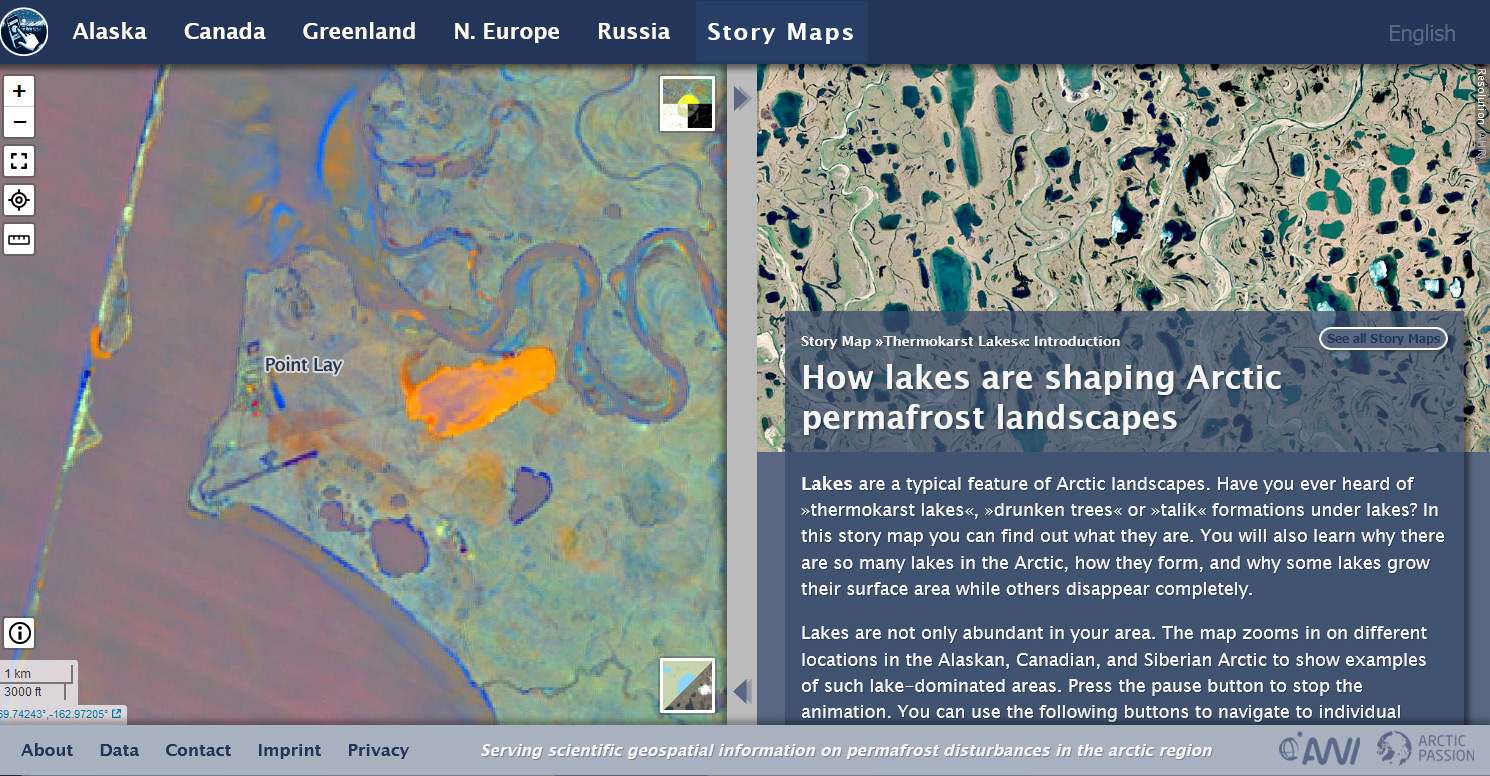
The Arctic
Landscape EXplorer (ALEX) with change data for Point Lay on the left and a
story map about thermokarst lakes on the right.